FRST Fact Sheet # 14: Using soil-test results to estimate P and K fertilizer rates
Soil testing helps farmers and crop advisors decide how much fertilizer or lime is needed to support profitable crop production. Fertilizer prices, crop management, soil testing methods, and environmental expectations have changed over the years. Updating fertilizer recommendations is necessary to improve the return on fertilizer and lime investments and reduce the risk of nutrient losses to the environment.
To improve these recommendations by bringing together soil fertility experts and field research data from across the U.S., the Fertilizer Recommendation Support Team (FRST) is developing a decision-support tool to make fertilizer and lime recommendations more cost-effective, transparent, and useful nationwide.
Fertilizer Recommendation Range
As soil-test values increase, less fertilizer is generally needed to maximize yield. However, crops grown under similar soil-test phosphorus (P) or potassium (K) values do not always respond to the same fertilizer rate. Weather, soil properties, crop management, and other growing conditions can affect crop response.
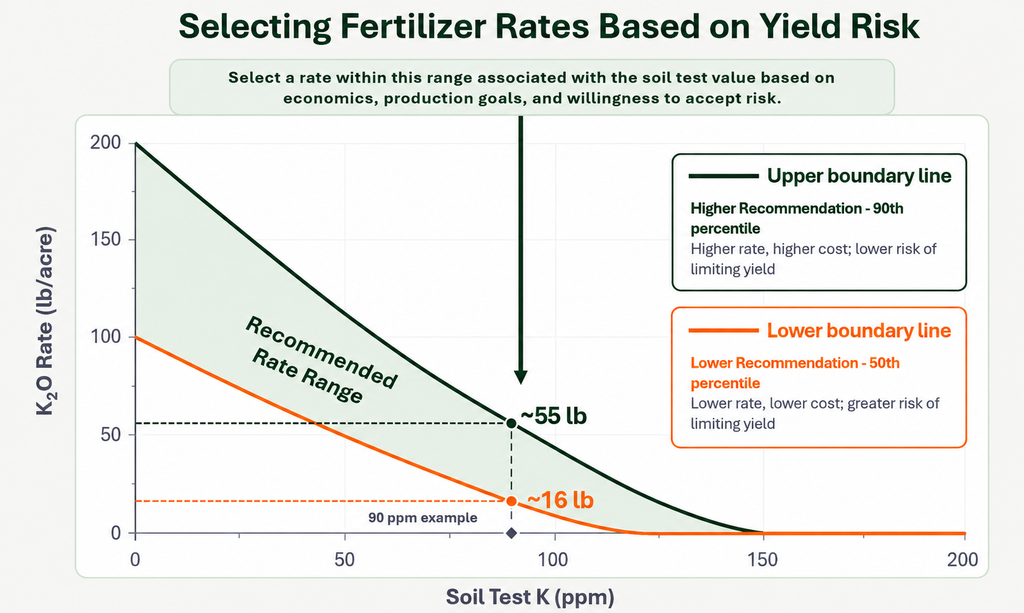
For this reason, FRST provides a range of fertilizer rates based on responses observed across many field trials, rather than relying on a single average rate that may not represent the optimal crop response in every field. Figure 1 illustrates how to select the fertilizer rate:
- The lower boundary line (in orange) represents the fertilizer rate sufficient to achieve near-maximum yield under typical nutrient-requirement conditions.
- The upper boundary line (in green) represents the fertilizer rate sufficient to achieve near-maximum yield under higher nutrient-requirement conditions.
- The green shaded area (Recommended Rate Range) represents the fertilizer rates sufficient to achieve near-maximum yield across field trials. For example, in Figure 1, if the soil-test K is 90 ppm, the recommended fertilizer rate would range from 16 to 55 lb K2O/acre.
The appropriate rate within this range depends on the farmer’s management goals and the desired balance between fertilizer investment and the risk that nutrient supply could limit yield.
Why can fertilizer needs differ among fields with similar soil test values?
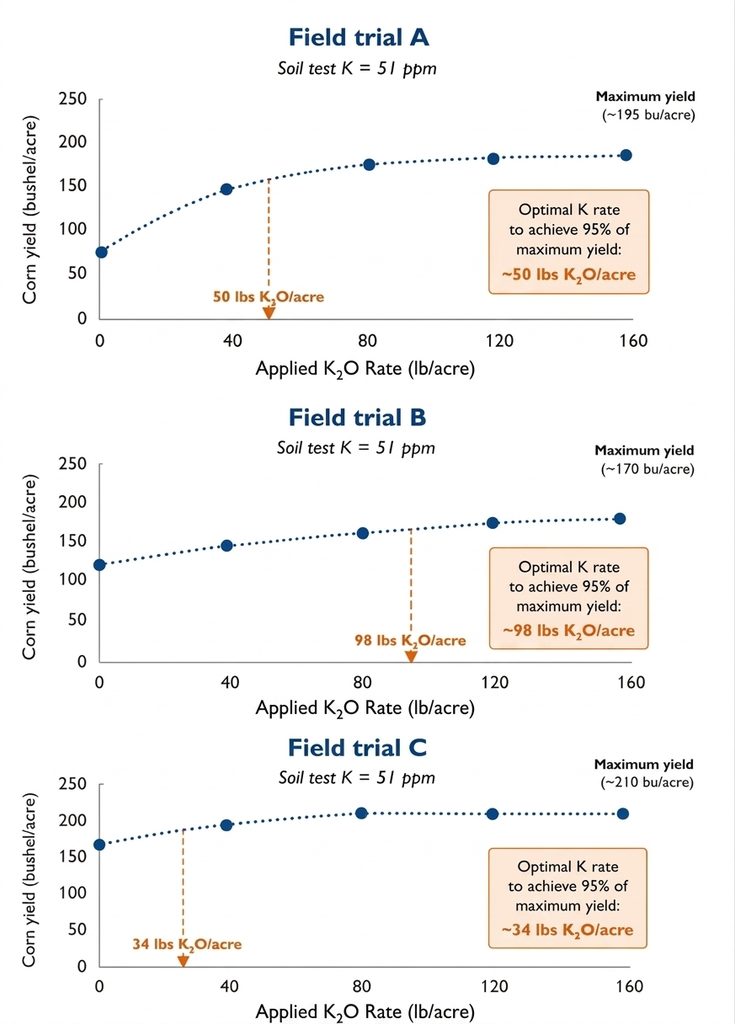
Soil test calibration uses crop-response data from field trials to estimate the fertilizer rate needed at different soil-test values. Fields with similar soil-test values can respond differently to fertilizer because soil properties, weather, crop management, and other factors differ. Figure 2 shows that corn fields with the same soil-test K (51 ppm) and similar maximum corn yields (170–210 bushels/acre) can require different fertilizer K rates to achieve 95% of maximum yield. These differences in crop response are why a single recommended fertilizer rate may not suit every field. The three fields also show that the fertilizer rate that produced maximum yield varies by field and may not be profitable.
What does this mean for farmers?
Fertilizer requirements depend on how crops respond under different growing conditions. FRST provides a range of fertilizer rates to account for field-to-field variability and different levels of risk that nutrient supply will limit yield. Using relevant field trials, as illustrated in Figure 2, and considering crop growing conditions and soil-test methods, FRST develops practical fertilizer recommendations based on soil-test values. The approach shown in Figure 1 estimates this range and produces a continuous recommendation curve that gradually decreases as soil-test values increase.
Knowing how much fertilizer is needed to produce near-maximal yield becomes especially important when fertilizer prices are high and crop prices are low. Using an appropriate rate can help avoid applying more fertilizer than needed and maximize return on fertilizer investment. These recommendations can also be combined with crop nutrient removal estimates to predict whether soil-test values are likely to increase, decrease, or remain stable over time.
Special thanks to our funders, including USDA-NRCS (grant NR233A750011G016), the U.S. Department of Agriculture National Institute of Food and Agriculture, Hatch National Research Support Project NRSP11, and Hatch and Smith-Lever Funds.
For more information, visit soiltestfrst.org.
For more detailed information
Filippi, J., Gatiboni, L., Buol, G., Spargo, J.T., […], & Slaton, N.A. (2026). Soil test calibration frameworks for estimating fertilizer phosphorus and potassium rate recommendations for the Fertilizer Recommendation Support Team. Soil Science Society of America Journal. In review.
Authors: J. Filippi (Univ. of Arkansas), L. Gatiboni (NC State Univ.), G. Buol (NC State Univ.), J. Spargo (Penn State Univ.), D. Kaiser (Univ. of Minnesota), R. Singh (Univ. of Arkansas), M. Yost (Utah State Univ.) & N. Slaton (Univ. of Arkansas). October 2026